
When investing in stocks, it is important to know whether a stock is being bought or sold. By knowing this information, you will be able to predict when the stock price will fall.
The Advance/Decline Ratio (AD Ratio) and the Advance/Decline Line (AD Line) are known as tools for knowing when stock prices will rise or fall. By using these indicators, you will be able to know when to buy stocks. These are important indicators to understand in chart analysis.
So how can we use the Advance/Decline Ratio and the Advance/Decline Line? What do these indicators represent?
By using the two indicators, you will be able to make money from stock investment. I will explain how to use the Advance/Decline Ratio and the Advance/Decline Line.
Table of Contents
The Advance/Decline Ratio and the Advance/Decline Line Show How Overheated the Economy Is
First of all, what are the Advance/Decline Ratio and the Advance/Decline Line? They are as follows.
-The Advance/Decline Ratio (AD Ratio)
- The ratio of the number of stocks whose prices rose divided by the number of stocks whose prices fell.
- AD Ratio = Number of stocks whose prices rose ÷ Number of stocks whose prices fell × 100
-The Advance/Decline Line (AD Line)
- The number of stocks whose price rose minus the number of stocks whose price fell.
- A/D Line = Number of stocks whose prices rose – Number of stocks whose prices fell
By checking these data, we can get an idea of how overheated the economy is. To be more specific, it is possible to know if a stock is overbought or oversold.
A Tool for Predicting Market Reversals Is the 25-day AD Ratio
How can we use these indicators? If the number of stocks that rise in price is the same as the number of stocks that fall in price, the Advance/Decline Ratio will be 100%. Also, the 25-day Advance/Decline Ratio is usually used. The 25-day Advance/Decline Ratio is the ratio of the number of stocks that have increased in price to the number of stocks that have decreased in price over the past 25 days.
In general, if the 25-day AD Ratio is 120% or higher, it is considered overbought. If the 25-day AD Ratio is below 80%, it is considered oversold. The AD Ratio rarely goes above 130% or below 70%.
Many investors use it to predict the timing of reversals in stock prices.
Whenever a stock is overbought, it will reverse and fall. If a stock is oversold, at some point the stock will be bought and the price will rise.
When a stock is oversold, the stock price is low, making it affordable. Because you invest when the stock price is low, you can profit from the increase in the stock price. Therefore, the AD Ratio is used to determine when to invest.
Of course, a low AD Ratio does not necessarily mean that the stock price will rebound. For example, during the Coronavirus shock, the 25-day Advance/Decline Ratio was about 40% in many indexes. Even if a stock is oversold, the stock price may fall more.
The AD Ratio should only be used as a reference when investing in stocks. There are no investors who make investment decisions based on the Advance/Decline Ratio alone.
Also, if you invest in individual stocks instead of indexes, you may lose a lot of money if you invest in stocks that are oversold. If you invest in a company that is not performing well, the stock price will not rise. Therefore, when investing in individual stocks, try to find undervalued stocks that have excellent performance but are oversold.
Checking the AD Lines Gives You an Idea of Bad Signs
Similarly, by checking the AD Line, you can also understand the trend of the economy. The concept is similar to the AD Ratio, but instead of a ratio, it is the daily difference between the number of stocks with rising prices and the number of stocks with falling prices.
In general, if the number of stocks with rising prices is high, the stock price will rise. For example, the following is the Advance/Decline Line of the S&P 500, which invests in the top 500 US companies.
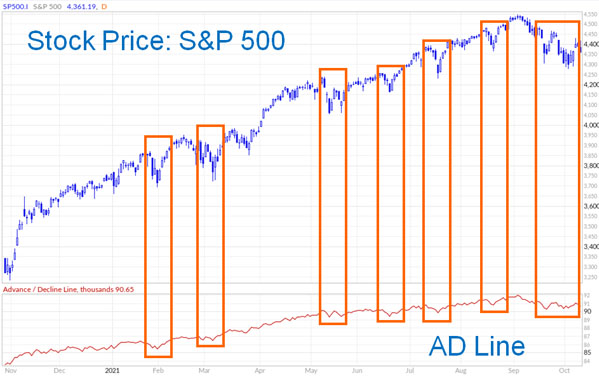
In this chart, the stock price is rising. In addition to that, the AD Line is rising. In the part where the stock price has temporarily declined, the AD Line has also temporarily declined. In general, when the Advance/Decline Line is rising, the stock price is rising.
The Case Study of the AD Line in Nasdaq, US Stocks
If there are a large number of stocks whose prices are rising, it may seem obvious that the stock price will rise. However, in some cases, the stock price may be rising even though the AD Line is falling.
For example, the following is a chart of Nasdaq’s stock price and Advance/Decline Line.
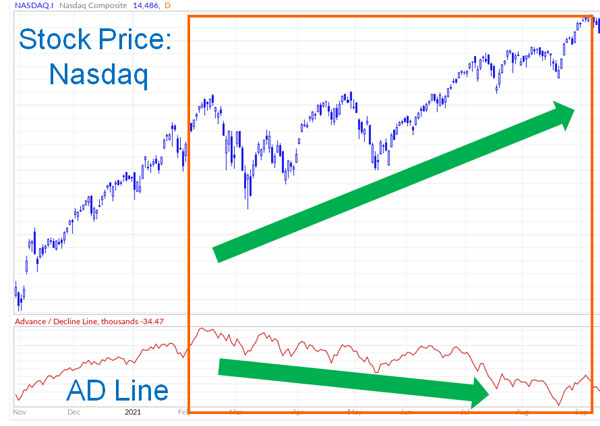
If you check the chart, you will see that the stock price is rising. However, if you check the AD Line, you will see that it is gradually declining. What does this mean?
Among the stocks listed on Nasdaq, many stocks are declining in price. However, if the stock prices of the giant companies listed on Nasdaq rise, the overall stock price of Nasdaq will rise.
Giant companies have large market capitalizations. Therefore, even if the stock prices of many companies fall, if the stock prices of a few large companies rise, the stock price of the index will rise. So for the same period, let’s check the Nasdaq 100 instead of Nasdaq.
There are many companies listed on Nasdaq. Among them, the Nasdaq 100 represents the stock prices of the top 100 companies. The following is the AD Line of the Nasdaq 100 for the same period.
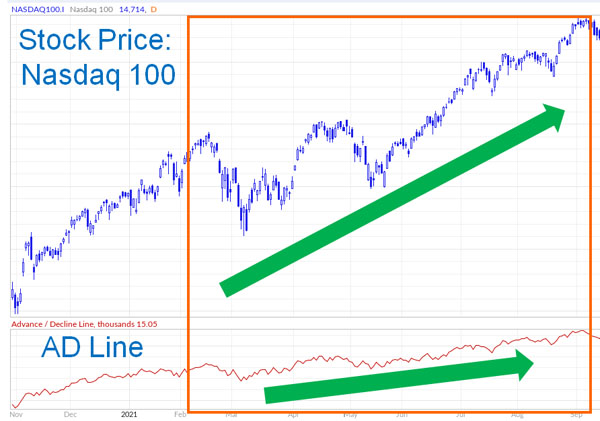
Thus, we can see that both the stock price and the AD Line are rising. In other words, the stock prices of the top 100 companies listed on Nasdaq have risen, but the stock prices of the smaller companies have not.
Why Your Stocks Are Not Increasing in Value Despite the Index Rising
When the stock price of an index is rising but the number of companies whose stock prices are falling is high, it is a bad sign for stock investment. Since many companies are concerned about their performance getting worse, there is a high risk that the stock prices of large companies will fall sharply if the economic situation turns even slightly worse.
Also, for those who invest in individual stocks, it is often the case that although the indexes such as S&P500, Nasdaq, and Dow Jones are rising, the stock prices of the companies they own are not rising.
The reason for this is that even if the index is rising, it does not necessarily mean that the stock price of the company you are investing in will rise.
As shown earlier, there are frequent cases where the Nasdaq stock price is rising, but the number of stocks that are falling in value is high. In this case, even if the stock prices of the S&P 500, Nasdaq, and the Dow Jones are at new highs, the stocks of the companies you are investing in are often falling in price.
More Important Information Is Interest Rates and Economic News
Although the AD Ratio and the AD Line are used in chart analysis, as mentioned above, they should only be used for reference. While the Advance/Decline Ratio and the Advance/Decline Line are indicators to check the economic trend, there are many other indicators that are more important in stock investment.
Stock prices are greatly affected by interest rates and economic news. For example, even if the AD Ratio is high, the stock price will continue to rise if the interest rate is low.
When investing in stocks, it is important to check the AD Ratio and the AD Line. However, compared to indicators such as interest rates, jobs report, and inflation rate, the importance of the Advance/Decline Ratio and the Advance/Decline Line is much lower.
The Advance/Decline Ratio and the Advance/Decline Line are rough indicators of when to buy stocks. Therefore, it is important to understand how to use the charts and consider them as a reference.
Using the AD Ratio and the AD Line in Chart Analysis
One indicator that shows whether a stock is overbought or oversold is the AD Ratio. By checking the AD Ratio, you can determine when to buy or sell a stock.
Also, by checking the AD Line, you can understand whether the economic condition is appropriate or not. Even if the S&P 500, Nasdaq, Dow Jones, and other indexes are rising, if the AD Line shows that many of the small-cap stocks are falling, you should consider that the economy is in danger.
However, in investing, the AD Ratio and the AD Line are not the key indicators for investors. Since there are other important indicators that have a significant impact on stock prices, the AD Ratio and AD Line should be considered as sub-indicators.
If you learn how to use the AD Ratio and the AD Line, you will be able to understand the economic situation. Use these tools as a basis for your stock investment decisions.
Related Posts
 Hedge Fund Commissions: Purchase Fee and Performance Fee
- Offshore Investment in the Isle of Man: Financial Relations with the UK
- System Trading Doesn’t Make Money, Backtesting in Investing Doesn’t Make Sense
- Review of Sun Life’s Victory Offshore Insurance for Asset Management
- Compounding Effects Are Great for Small Investments by Beginners
- Can Private Equity (PE) Alternative Investment Funds Be Profitable?